What buying leaders at and near new highs actually looked like in practice — a tracked roster of 15 names committed to after the confirmed follow-through day of April 8, 2026.
Most investors instinctively wait for a pullback. The market rarely rewards that instinct after a confirmed follow-through day. A leader at a new high has already absorbed every seller above it — there is no overhead supply, no one trapped from higher, nobody waiting to "get out at break-even." When the broad market signal turns green at the same moment, the path of least resistance is up.
This cohort is the practical case for that idea. After April 8 produced a follow-through, the names that worked were not the beaten-down bounces. They were the stocks already at or near their 52-week or all-time high, with strong relative strength and sector tailwinds. Market direction (CANSLIM®'s M) and the new-high signal (the N) ran together, and the L — leadership — sorted the winners from the rest.
A follow-through day (FTD) is the technical signal that an active correction has flipped to an emerging uptrend — a major index advancing meaningfully on heavier volume, typically four to seven trading days after the first day of a rally attempt.
April 8 produced an FTD across the leading growth indexes. The distribution-day cluster cleared and the leadership profile shifted from defensive to offensive inside the same session.
Volume rose, not faded. The biggest gainers were not low-quality bounces — they were names that had been carving constructive bases through the correction, suddenly breaking out together.
The first three to four weeks after an FTD have historically produced the best risk-to-reward of a new cycle. That is the window this cohort was committed to.
Three charts make the lesson concrete — the market that turned, the leadership group already at new highs, and a personal trade that shows what hesitating on the signal costs.
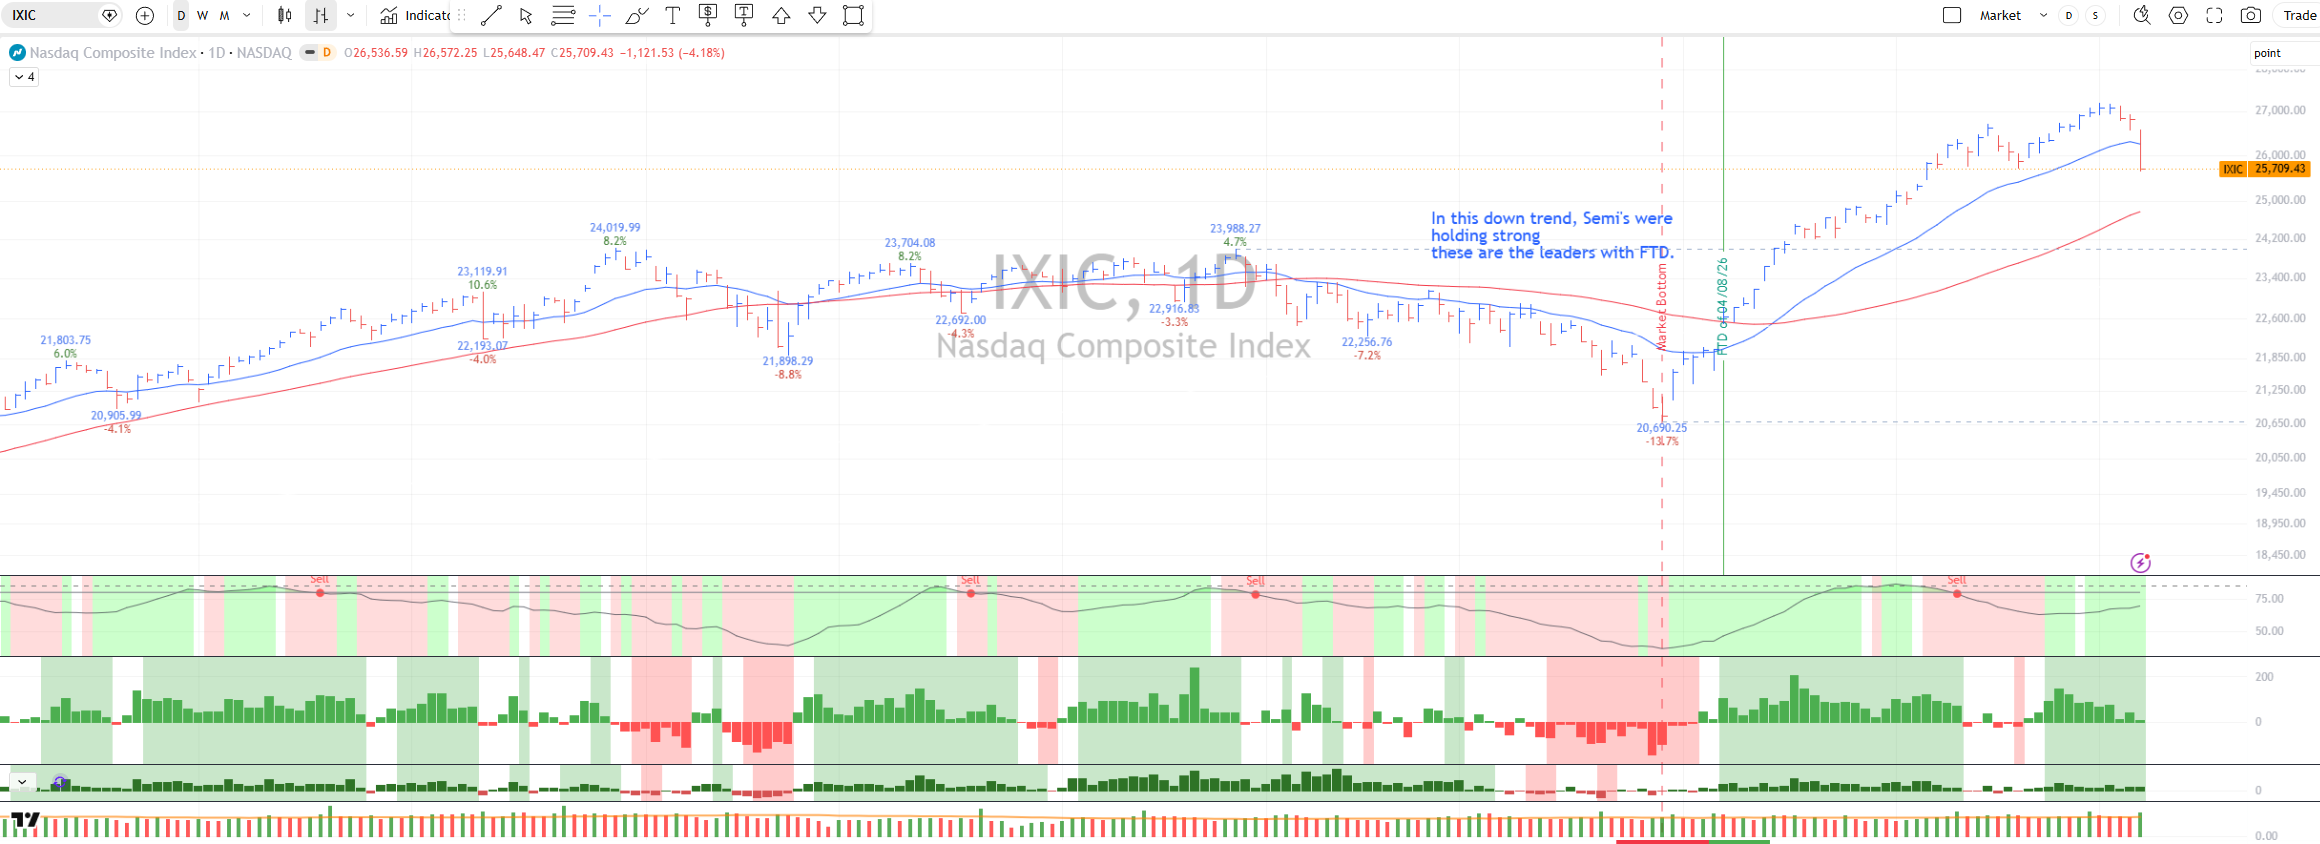
A drawdown of nearly 14% from the highs, a clean undercut into the market bottom, then the follow-through day on April 8 turning the broad signal green. Nothing on the individual chart side could be acted on until this turned — the M letter always gets the final word. Watch the down move too: the semis were already holding their ground while the index sold off. The leadership signal was visible before the market signal flipped.
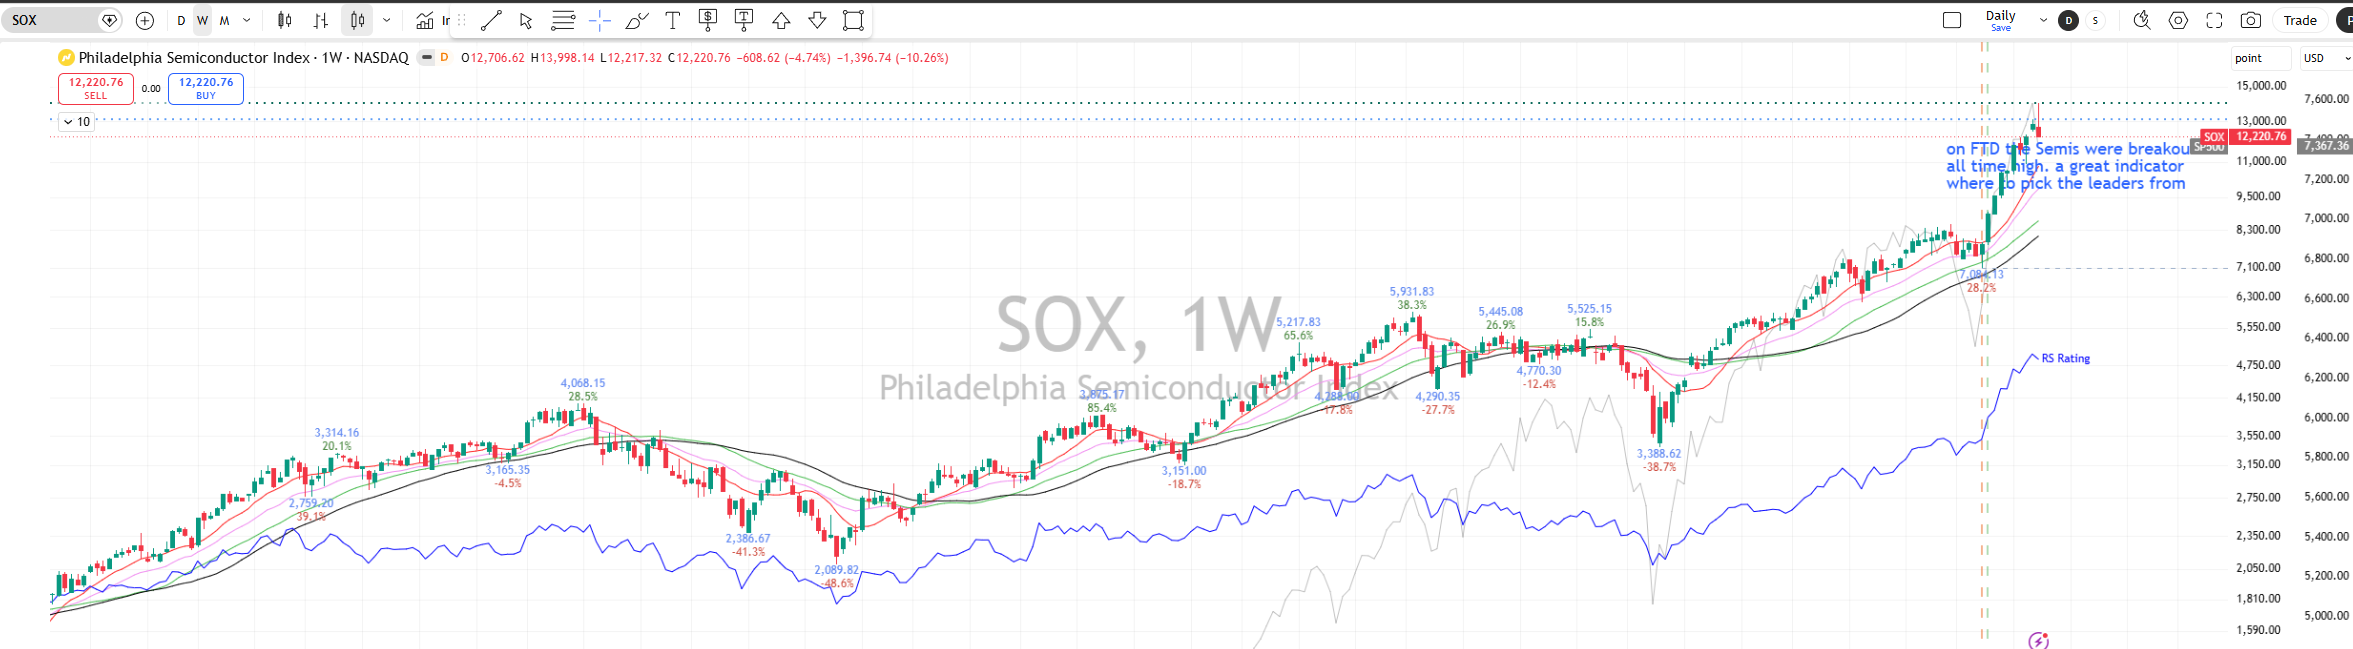
On the same day the Nasdaq printed its follow-through, the SOX broke out to a fresh all-time high. A leadership index hitting new highs on the FTD is the strongest possible alignment — it tells you not just that to act, but where. Pick names from inside the group that's already doing the work; let the index point at the sector with the strongest tape. That is why fourteen of the fifteen names in the cohort below sit in or adjacent to the semi/AI build-out.
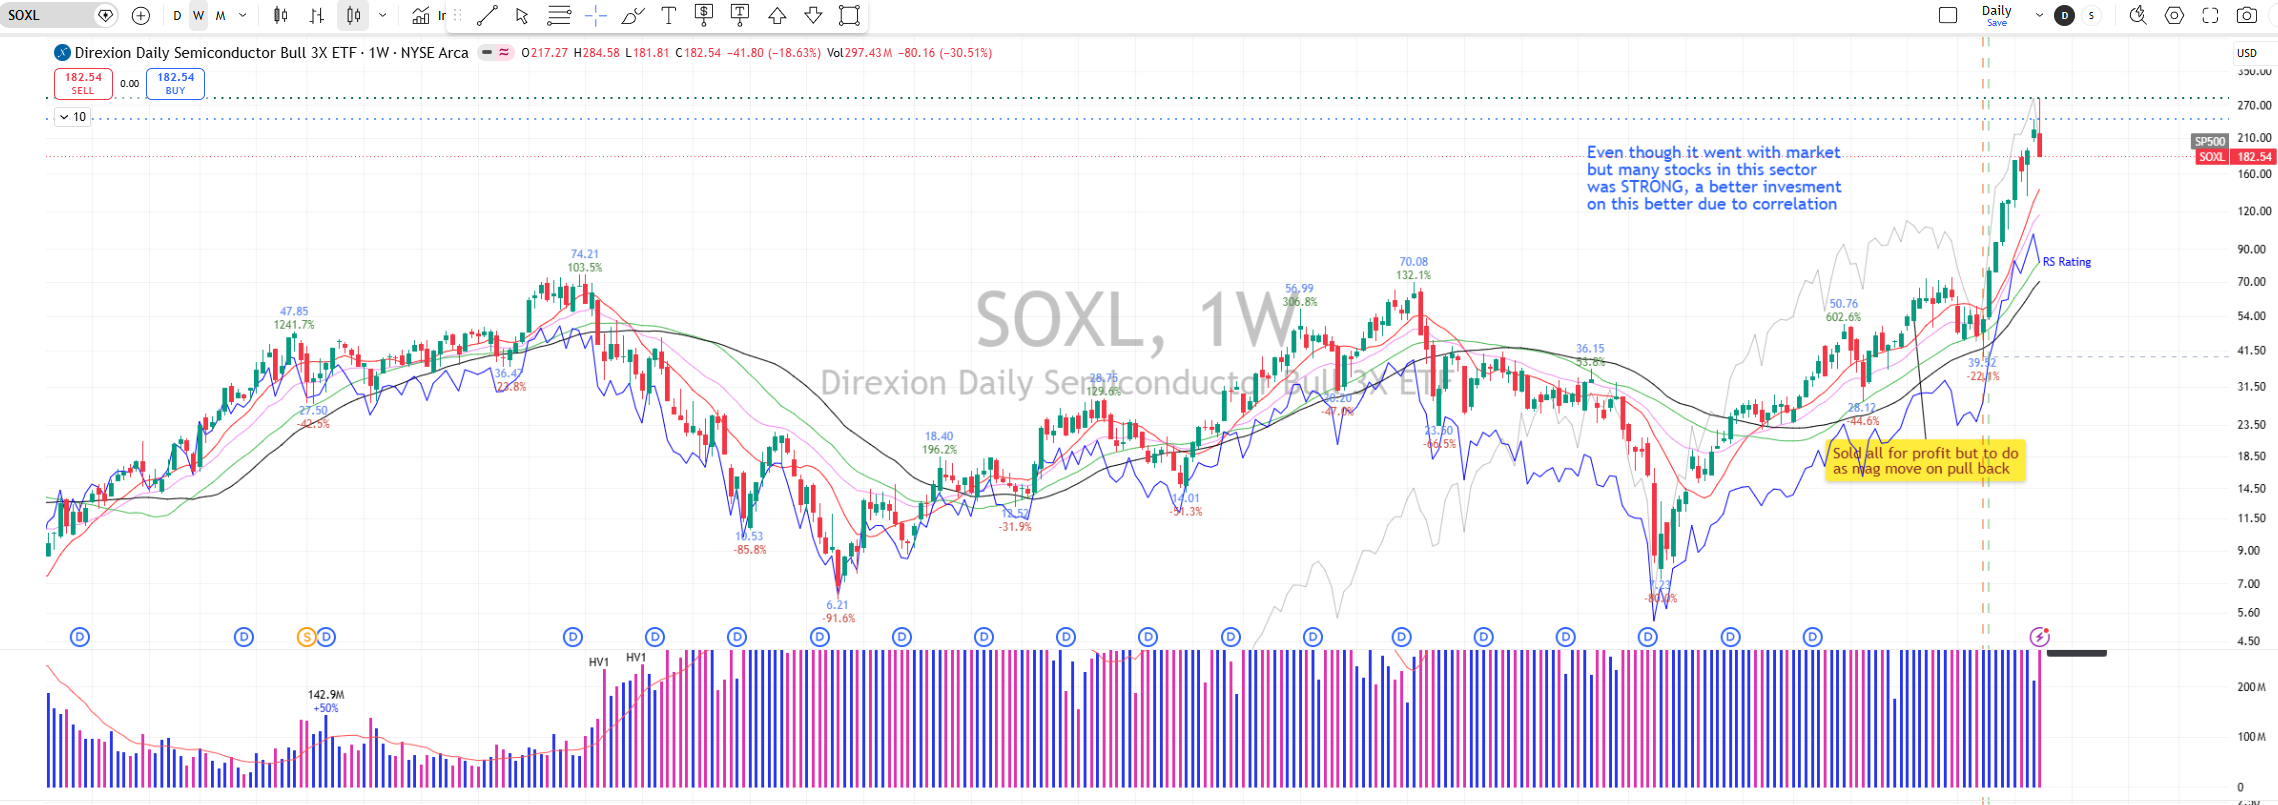
A real position, held since 2021, sold for a clean profit as the correction took hold. That part was the rule book working: when the market signal turns red, take what you have earned. What followed was the harder lesson. The FTD came. The leadership group (semis) was already pressing new highs. The re-entry signal was as clear as it gets — and the buy-back didn't happen, because the expectation was “it will crash again, I will buy lower.” It never did crash again. The chart just kept going. That is a lock-out rally: a move that runs without offering sidelined money a single clean pullback to re-enter, punishing the trader who is waiting for a “better price” that is not arriving. Roughly 200% of upside passed by, in plain sight, while the position sat in cash.
The takeaway. Selling well is half the job. Re-entering on a clean signal is the other half. After a confirmed FTD with leadership already at new highs, the move can run for weeks without giving sidelined money one clean pullback — that is the definition of a lock-out rally. The cohort above is, in part, a written commitment to not repeat this miss: when the signal arrives, the signal is the entry. There is no "wait for the dip" rule that helps here.
No single filter found this cohort. The selection stacked several gates — any name that cleared all of them earned a place.
A confirmed FTD on a major index. Without the M letter passing, no individual idea was acted on. The general market gets the final word.
CANSLIM® · MNames trading inside the upper band of their 52-week range, or pressing against an all-time high. Distance from the yearly peak (the Δ 52WH column) was the primary screen.
CANSLIM® · NHigh Relative Strength rank and clear group leadership. Semiconductors, memory, storage, and AI infrastructure carried the weight of the cohort.
CANSLIM® · LA sound chart pattern at the entry — cup-with-handle, HL/HH continuation, MB-2LYNCH momentum burst, or KQ mean reversion off the 10-week. No chasing.
CANSLIM® · N + SThe trigger was a clean 4% breakout from the consolidation. No anticipation entries in this cohort — the breakout had to come to the trader, not the other way around.
Entry ruleEvery position carried a written sell plan — peel into strength on parabolic days, exit on exhaustion candles, hard stop if the base broke. Sells were not improvised.
Risk overlayEach row is a name committed to in the days following the FTD, with the chart setup that qualified it, the entry trigger, the sell plan, and the position's status today. Strictly a study log — not a recommendation.
Sheet not displaying? Open it in a new tab ↗
A quick guide to the framework vocabulary in the cohort tracker — so the data reads like a story, not a code dump.
Distance from the 52-week peak. Small numbers mean the stock sits right at its highs — the leader signal.
Relative Strength versus the market. 99 = top 1%; single digits = laggards. The cohort skews high.
Plain-language description of why the name qualified — chart context plus sector theme.
Trading-type tag. EP9M-CAT/CANSLIM means a high-quality episodic pivot with deep liquidity.
The base pattern at entry — MB-2LYNCH (momentum burst), CWH (cup with handle), KQ (Qullamaggie mean reversion), and so on.
The trigger that initiated the position — here, consistently a 4% breakout from the consolidation.
The pre-written exit plan — peel into strength, exit on exhaustion, hard stop on base break.
Return since entry. The cohort range, top to bottom, runs from triple-digit to mid-triple-digit gains.
Five takeaways that show up again and again across the 15 names — the actionable spine of this case study.
A Model Book is honest by design. A few caveats that keep this case study from being mis-read as a guarantee.
Selection and survivorship bias. The cohort is the set of names committed to under the rules and carried with discipline. The same rules also produced false starts and abandoned names that are not on this list. Don't read 100% positive returns as 100% probability — read them as the result of stacking gates and respecting stops.
Hindsight flatters. Every chart in review looks cleaner than it did in real time. The cohort lived through whips, gaps, and shakeouts — the kind that make you doubt the entry on day three. The rule book is what kept positions alive long enough to compound.
The cycle had specific tailwinds. The 2026 setup carried unusual sector concentration (the AI/semi build-out). A future FTD without a strong leadership theme is unlikely to produce returns of this magnitude. The lesson scales; the size of the win does not.
Sells matter as much as picks. Every name in the cohort was managed against written exits. Without those, this would be a list of paper gains, not realized lessons.
The full write-ups, the chart breakdowns behind each name, and the weekly model chart on managing monster returns are published to subscribers on Substack.
Subscribe on Substack →