The real-money tape: how the true leaders — and your own holdings — are actually behaving. Often the earliest and most honest warning you will get.
Indicators lag; the tape does not. The cleanest read on direction is how the true market leaders — and your own holdings — are actually behaving. When the best stocks and your best setups start acting badly, that is often the earliest and most honest warning you'll get, well before it shows up in the indices.
| Healthy tape | Deteriorating tape |
|---|---|
| Breakouts work and hold their gains. | Breakouts fail and reverse — bull traps. |
| Leaders trend and reset in orderly bases. | Leaders break down on heavy volume. |
| Pullbacks get bought; dips stay shallow. | Gains give back; big red days close on the lows. |
| Broad, high-quality leadership. | Leadership narrows, or rotates to defensive, low-quality names. |
| Your positions act well; stops sit safe. | Relative-strength lines roll over; your stops keep getting hit. |
The same footprint work that finds sector rotation also reads the market's turn. At a market bottom, the earliest tell is often a monster volume footprint on a single leader — days before the index prints its follow-through day. Institutions accumulate the strongest names first; the FTD is the confirmation that catches up after. Watch the leaders' tape, not just the index.
Live example — the 04/08/2026 FTD. On 04/01/2026, Micron (MU) put up a conspicuous high-volume day while the broad market was still in its correction. It was a footprint of institutions stepping in — a signal that things were brewing. One week later, on 04/08/2026, the market delivered its follow-through day and the semiconductor complex broke out into leadership. The stock's footprint came first; the index signal confirmed it.
This is the stock-first, footprints-first principle applied to the market turn itself — stock, sector, and index are one signal read at three different lags.
A subtle but critical read: when your own well-chosen setups suddenly stop working and stops keep triggering, the market is telling you something the indexes may not show yet. A change of character — the small, tight, orderly gains of a healthy trend giving way to wide, sloppy, heavy-volume swings — is the tape turning. Let it override the optimism of any single indicator.
The way I monitor and track leadership on this instrument follows one principle: individual stock relative strength is primary; industry-group strength is confirmation. A group rank is an average, so it always trails its strongest names — wait for the group to look strong and you miss the first, largest leg of the move.
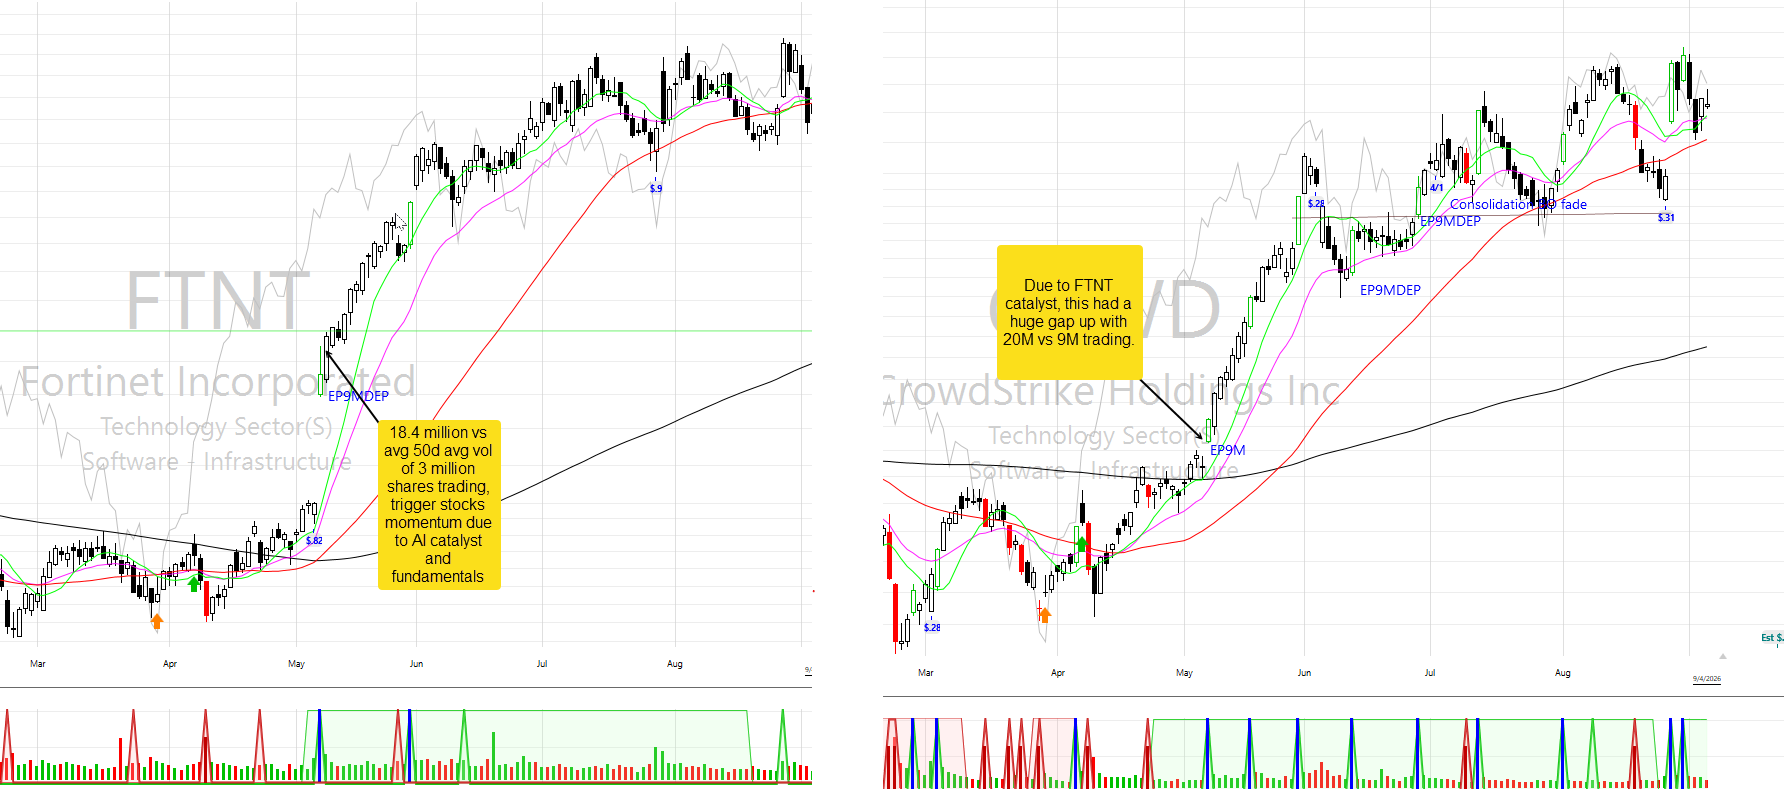
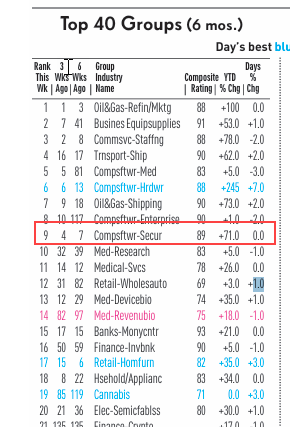
On 05/07/2026, Fortinet broke out from the bottom of its base on an AI-cybersecurity catalyst and a huge institutional volume footprint — and pulled CrowdStrike up the same session. At that moment their Security Software group ranked 30th of 200. Their momentum dragged the group to 9th over the next four months. The leaders lit the sector, not the reverse.
| Pattern | What it looks like | Example |
|---|---|---|
| A · Classic | Strong stock inside a strong group — months of sector momentum, constructive bases. | SNDK |
| B · Emerging | Strong stock in a weak group — the stock catalyst triggers the move and creates the group's later strength. | FTNT & CRWD |
The tracking rule: rank the stock's relative strength first, note the group second, and never disqualify a genuine leader just because its group hasn't caught up yet.
Direction is a cross-check, never one gauge. Read the other instruments, then bring them together.
Is money flowing in or out, and across how many stocks — the Stock Bee monitor, decoded.
Open the guide → B · InstrumentThe indices' own footprints: distribution days that warn of a top, and the follow-through day that confirms a bottom.
Open the guide → C · InstrumentNew 52-week highs against new lows on the NASDAQ and NYSE — divergences and capitulation washouts.
Open the guide →