How Fortinet and CrowdStrike lit up a weak Security Software group from the bottom of their bases — the case that individual stock momentum leads sector momentum, not the other way around.
During a correction, the stocks that resist the downside best are quietly telling you who the next leaders are. When the follow-through day arrives, buying the strongest names from the strongest groups is a high-probability play — that part of the CANSLIM® playbook is not in dispute. But there is a second, subtler truth that this case study exists to prove: as a market transitions into a Power Trend, new leaders emerge from groups that still look weak. If you wait for the industry group to strengthen before you act, you routinely miss the first — and largest — leg of the move.
Fortinet and CrowdStrike are the cleanest example I have on file. Their group, Security Software, was ranked 30th of 200 when they broke out. Their own momentum dragged the group up to 9th. The leaders lit the sector, not the reverse.
On the 04/08/2026 follow-through day, the top-ranked industry groups were a tight cluster around one theme — the AI hardware build-out. Buying leaders out of that cluster was the high-probability call, and it worked.
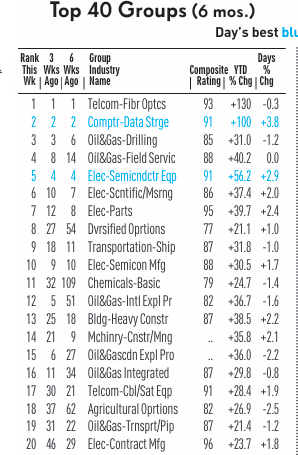
The leadership cluster on the follow-through day was almost entirely the semiconductor / AI-hardware complex — fiber optics, data storage, semiconductor equipment and manufacturing all pressing the top of the list. This is exactly the environment where the classic rule shines: pick the strongest stocks from these top groups and let the market's own ranking point you at the sector doing the work. We published the cohort that proved it in the April 8 FTD study.
So where is the problem? Nowhere — yet. The classic rule is correct on the FTD. The problem is what happens next. A Power Trend is not static: leadership broadens and rotates. New names begin to move weeks before their group ranking reflects it, because a group rank is an average and an average always lags its strongest member. If your only filter is "buy from a top-ranked group," you are structurally late to every leader whose group has not caught up yet.
On 05/07/2026, Fortinet broke out from the bottom of its base on an enormous institutional volume footprint. Its move pulled CrowdStrike with it the same day. At that moment, their group was ranked 30th of 200.
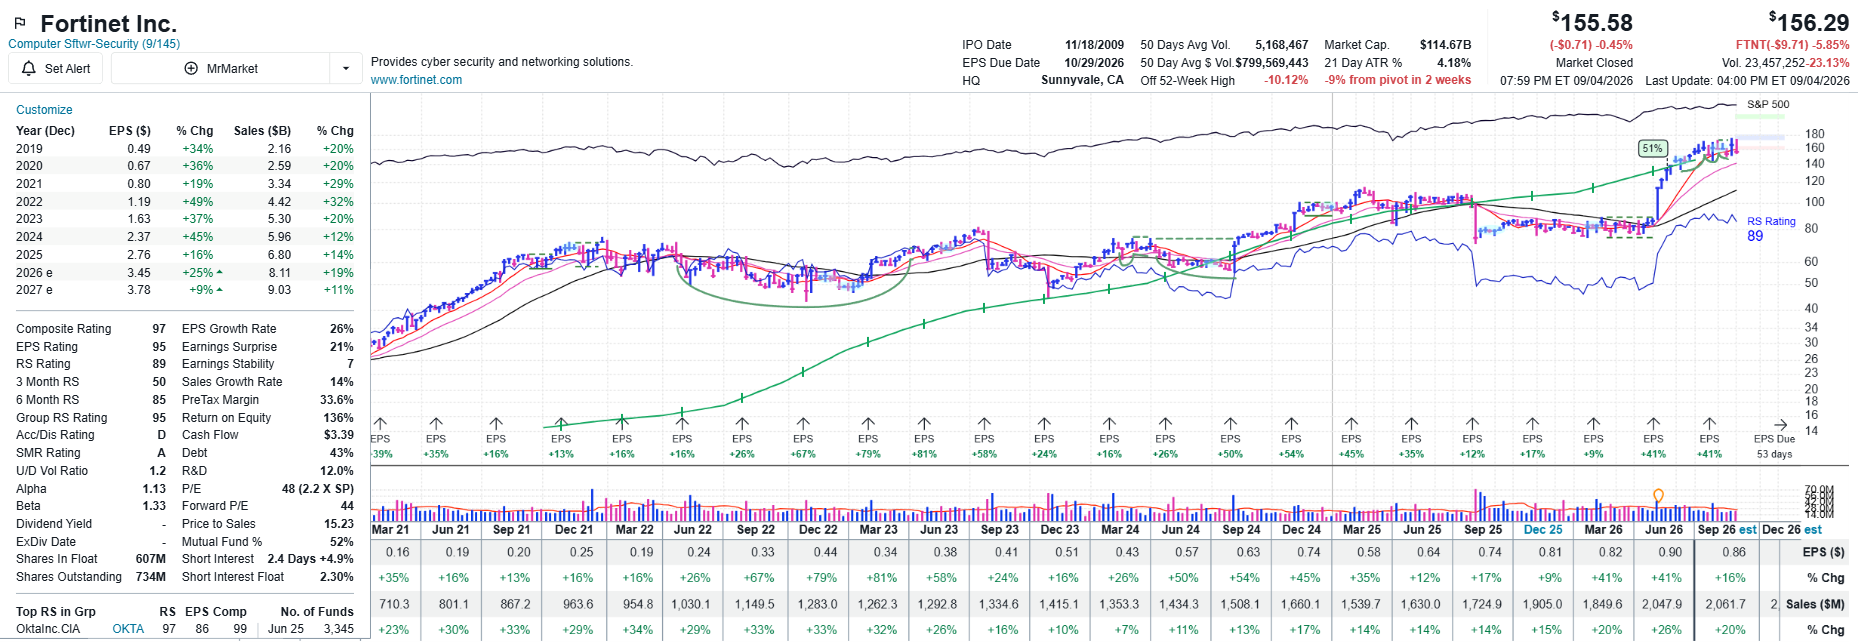
Fortinet broke out of its base on 05/07/2026 on an AI-driven cybersecurity catalyst, backed by accelerating sales and EPS. Composite 97, EPS 95, RS climbing — a fundamentally-loaded breakout, not a low-quality bounce.
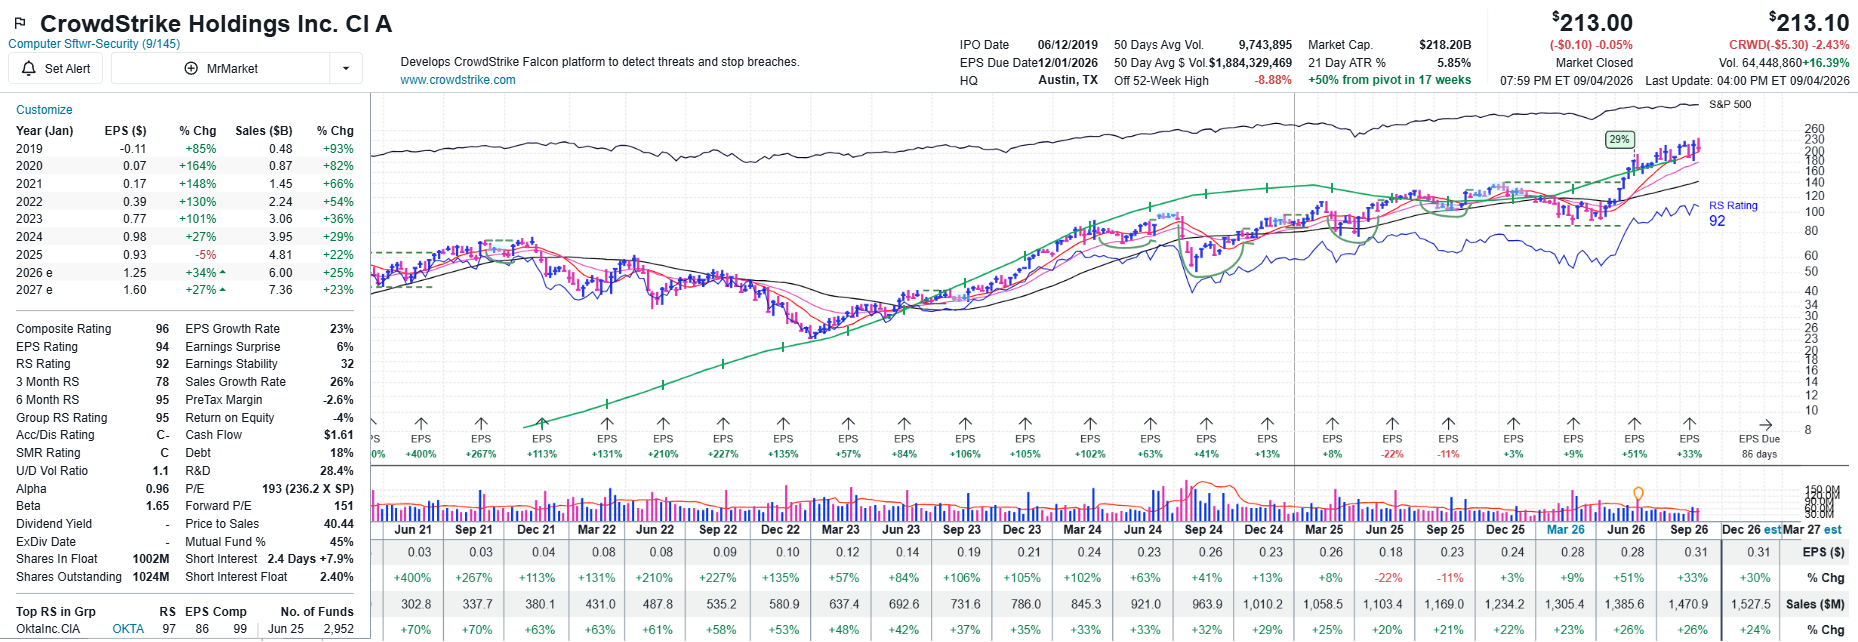
CrowdStrike gapped up hard on the same session, carried by the read-through from Fortinet's catalyst. Composite 96, RS 92 — a second leader in the same group lighting up off one stock's move.
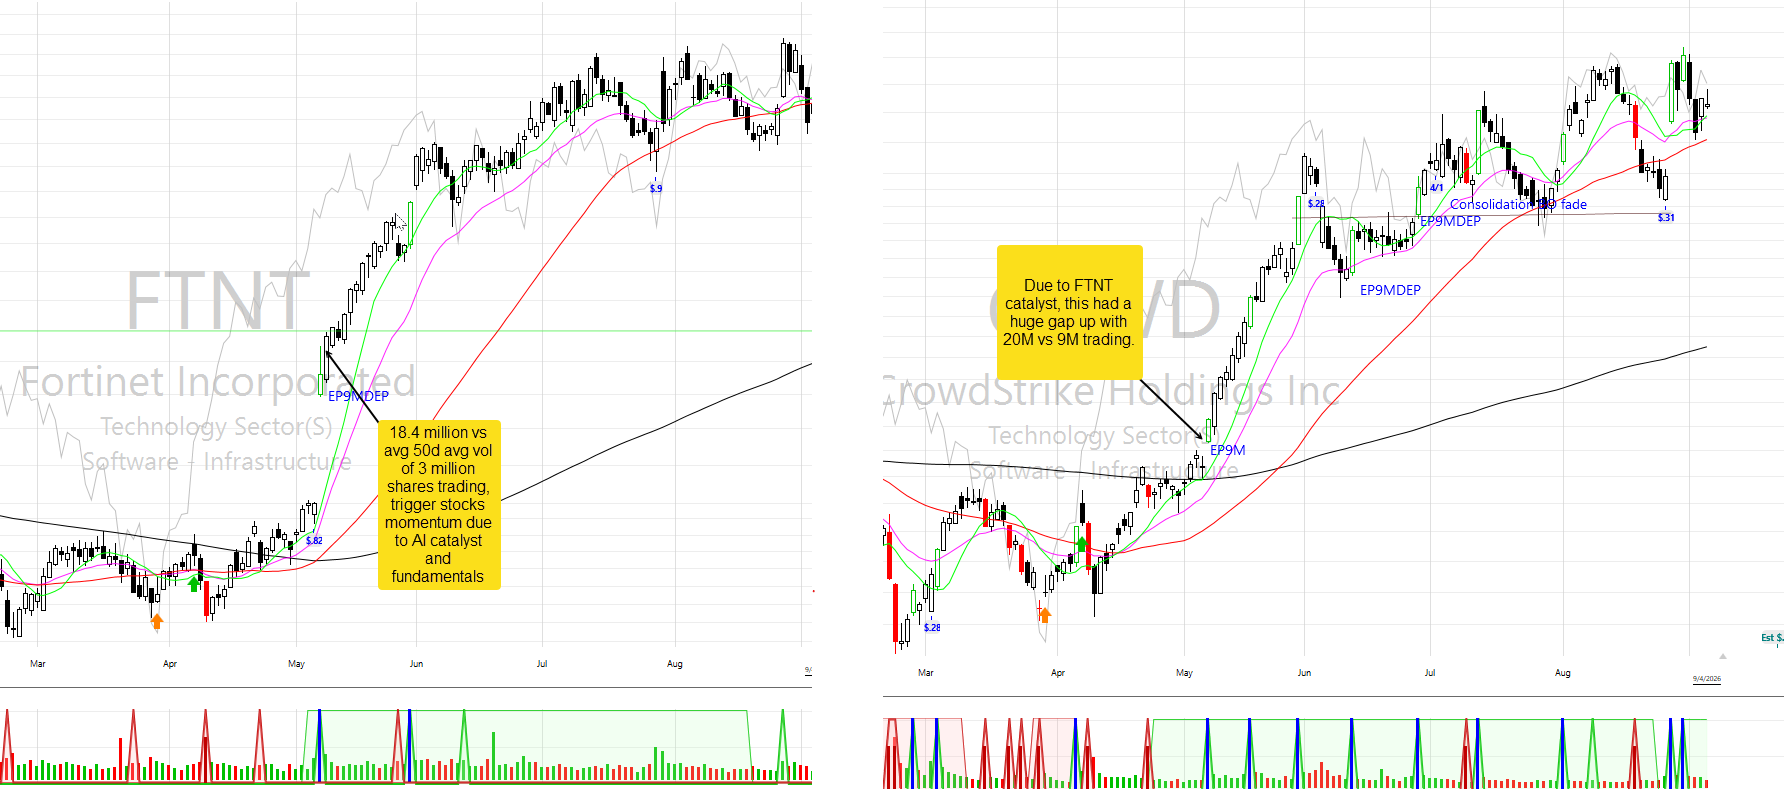
The tape leaves fingerprints. FTNT traded 18.4M shares versus a 3M 50-day average on its breakout — a >6× volume surge. CRWD gapped up on 20M versus 9M average the same day, explicitly on the FTNT read-through. Those are institutional footprints, the kind that mark a real change of character rather than noise. Two leaders, one catalyst, one session — and the group had no idea yet.
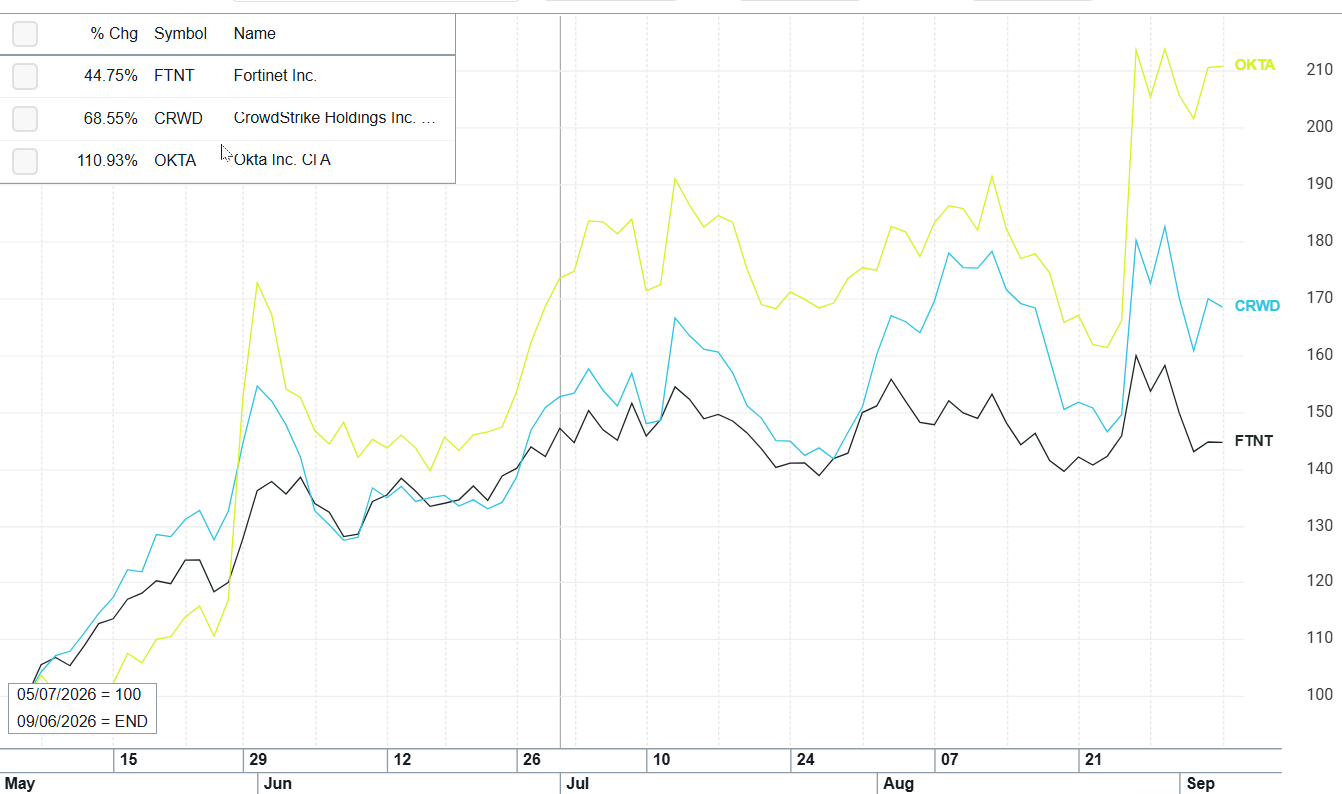
Rebased to 100 on the breakout date, the leaders ran together: FTNT +45%, CRWD +69%, and OKTA +111% — OKTA being the group's top-RS name that joined the party. This is what "the leaders pull the sector up" looks like as a picture: three strong stocks compounding while the group ranking was still catching up.
Group strength is the effect here, not the cause. Watch the Security Software ranking climb after the leaders had already moved.
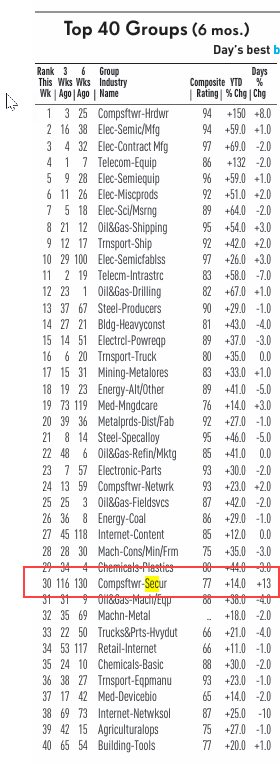
By the time Security Software reached 30th, the ranking columns still showed it at 116 three weeks prior and 130 six weeks prior. The group was deep in the second half of the list while its two best stocks were already breaking out. Anyone waiting for a top-tier group rank had no reason to look here yet.
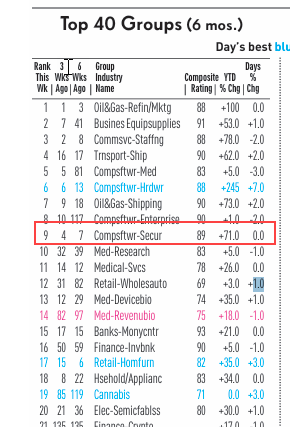
Four months later the group sat at 9th of 200, Composite 89, up 71% year-to-date — a bona-fide leadership group. But the return was already substantially captured by the traders who bought the stocks in May. The group rank confirmed the move; it did not call it.
The sequence is the whole point. Stock catalyst → institutional volume footprint → leaders run → group average rises → group rank enters the top 10. Individual momentum ignites first; sector momentum is the smoke, not the spark.
This is not an anomaly. It is structural — and it repeats.
An industry-group rank is an average of every stock in the group. By construction, an average trails its strongest members — the leader has to pull the mean up before the rank moves.
A powerful story or earnings acceleration — FTNT's AI-cybersecurity demand — can drive a single stock regardless of where its group ranks that week.
FTNT and CRWD broke out from a group ranked 30th. Waiting for the group to look strong would have meant entering after the first, largest leg was over.
Sector strength usually follows the leaders. The group rank is downstream of the price action of its best names, not upstream of it.
A group can look strong because of one or two heavy-hitters while the rest are weak. Screen the group first and you risk buying the tired names inside a "strong" group instead of the actual leader.
Recognizing only one of these patterns leaves money on the table. The complete approach watches for both.
The textbook CANSLIM® setup: a leading stock inside a leading group, forming bases and pulling back constructively while sector momentum runs for months. Highest-conviction, most durable trades.
Example: SNDK. A data-storage leader riding months of sector momentum — up ∼511% from its pivot in 35 weeks, EPS exploding, group RS at 97.
The stock catalyst arrives before the group does. Group ranked 30th, but a real story and a real volume footprint trigger the move — and that momentum creates the group's later strength.
Example: FTNT & CRWD. Early entries on the stock signal captured the whole move before the group ranking improved from 30 to 9.
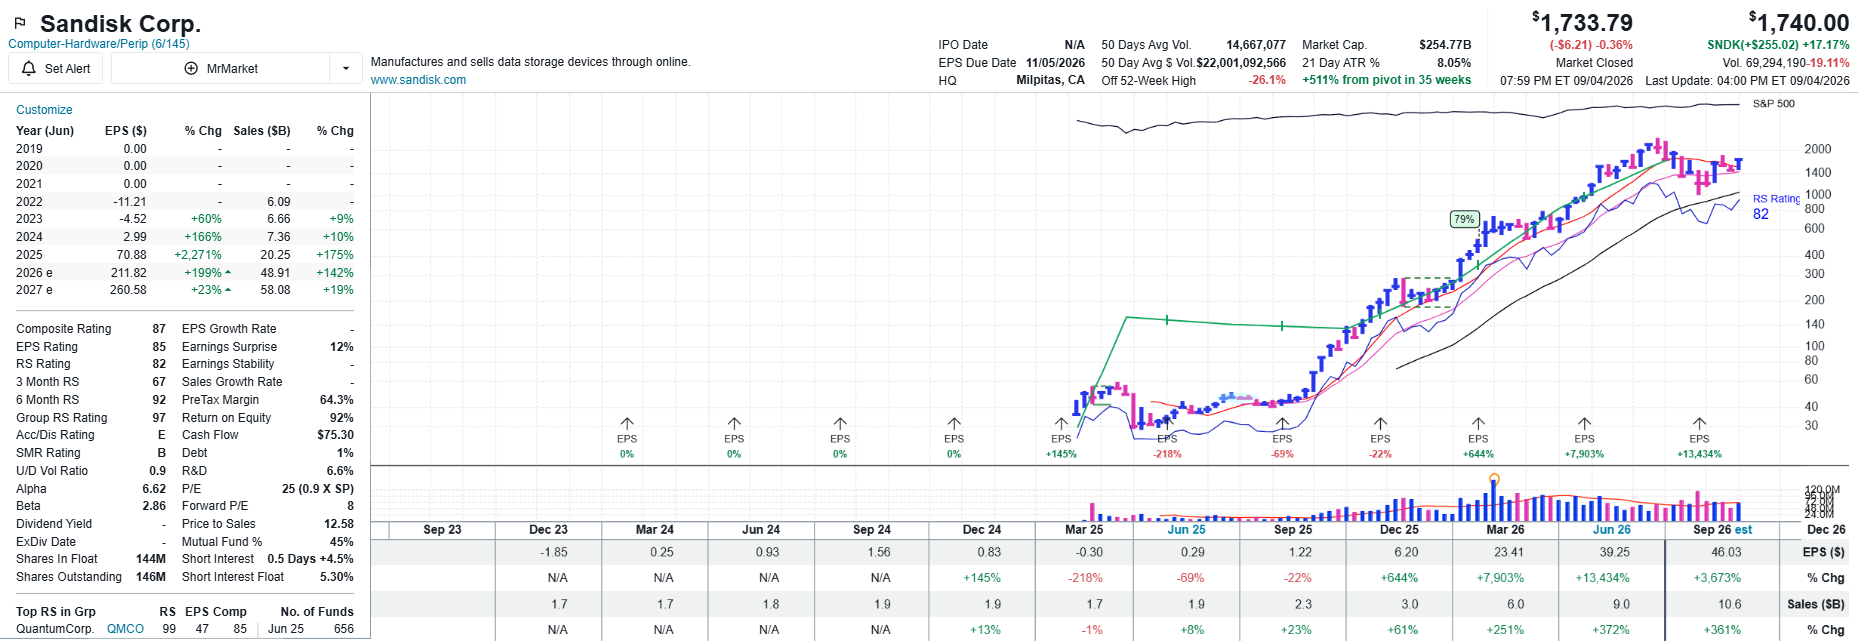
SNDK is what Pattern A looks like: a leader inside an already-strong group (Group RS 97), building bases and resetting cleanly while the sector's momentum lasted for months. This is the ideal traditional group-leadership trade — and it does not contradict the thesis. Both patterns are real; a complete growth strategy trades both.
The most effective growth strategy leads with individual stock relative strength and uses industry-group strength as confirmation, not as the first gate. A rising leader in a lagging group is not a contradiction to resolve — it is often the highest-reward entry on the board. This is the principle that governs how leadership is monitored and tracked at Trade2Swing.
Codified as House Rule 02 — Stock First, Group Second. This study is the origin case for the rule. The terse, referenceable version lives on the House Rules page.